By Andreja Jarc.
Introduction
Meinberg LANTIME servers with a fw 6.17.004 or higher are enhanced with a new NTP monitoring feature. This feature enables monitoring of NTP performance of up to 100 external NTP nodes (servers and clients) attached in a local or public network. NTP values, such as offset, delay and jitter are queried regularly from the nodes by a master LANTIME server with the prior activated monitoring feature. Data are polled by a special Meinberg routine similar to ntpdate in intervals configured for each NTP device individually. A default is set to 64 s.
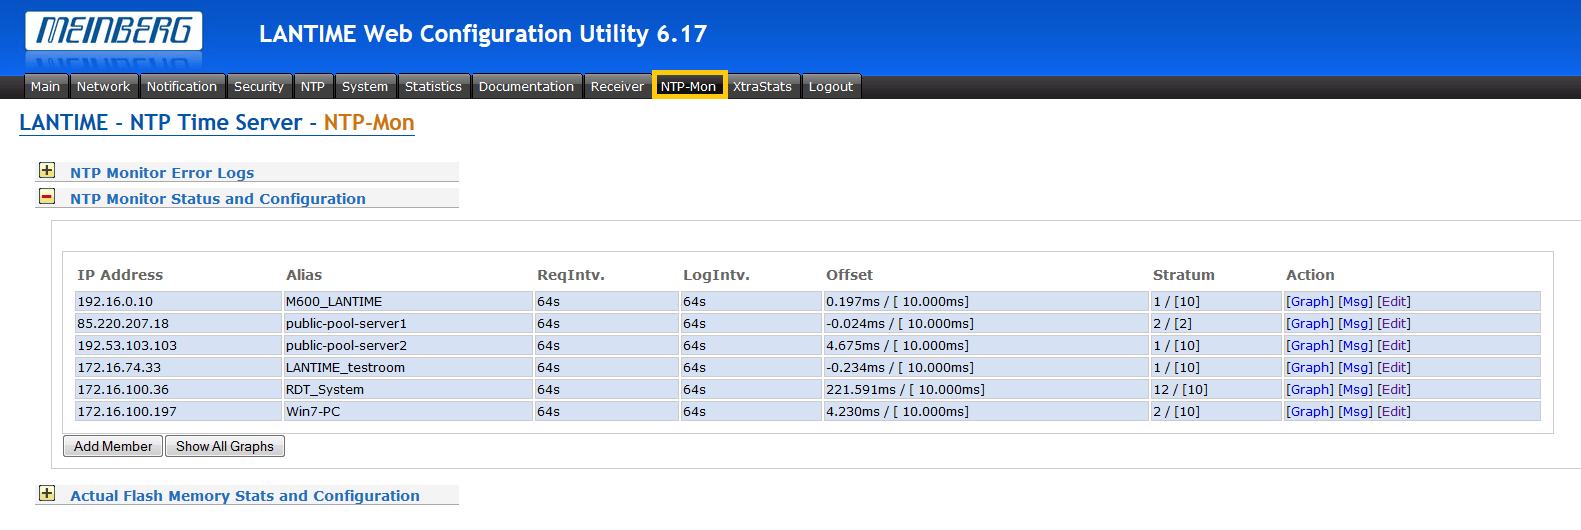
Figure 1: A printscreen of the NTP-Mon menu in Web GUI / LANTIME M600.
NTP data received from each client are compared to an internal clock of the master with a highly stable oscillator disciplined to GPS or another reference signal. If predefined offset and stratum limits are exceeded on any of devices being monitored an alarm message is triggered and may be sent via different messaging channels (e.g. email, SNMP trap or other user defined notification media).
The monitored data may be graphically represented in different time periods: e.g. current day, week and month or in a manual selected range. Moreover, the data can be depicted in adjustable scales to provide a detailed trend or rather a coarse overview through a larger time scale.
The application provides with a clear error logging system where occurred events from all monitored nodes are protocolled. Global error logs can be archived for the later use and further analysis. The logging data referred to individual nodes can be filtered out by it’s IP address. The NTP monitoring feature is especially helpful for labs and testing environments to measure network latencies and time offsets between different NTP nodes in various network architectures (controlled LAN, WAN, or public internet time service).
Experiment Design
To test the performance of the NTP-Monitoring we used a Meinberg LANTIME M600/GPS as a master and queried NTP data from the following NTP nodes:
- Direct link with a LANTIME M300/GPS at Stratum 1 used as the reference for NTP performance.
- LAN connection with a LANTIME M600/GPS at Stratum 1 (no routers or “hops” in the data link).
- LAN connection with a Windows PC (64-bit Win 7 Professional) at Stratum 2 (no hops in the data link).
- Public NTP server from the ntp.pool project at Stratum 2. Using a Linux command:
traceroute <IP Address> we checked the number of hops in the link between the master and the selected server. The higher hops number is not a certain indicator for higher offset and delays in a network. However, it is a reasonably good estimate for NTP performance and its accuracy. In our case there were 9 hops in the data link between both end devices.
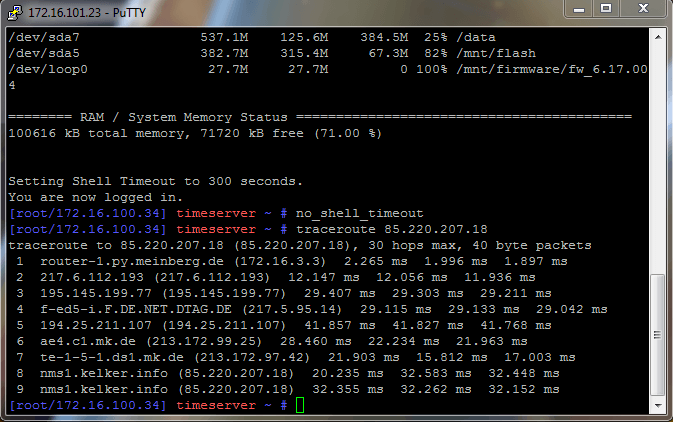
Figure 2: 9 hops in the data link between the master and a given ntp.pool server.
Results
In the following figures the NTP performance (red line) of four different NTP nodes compared to a GPS disciplined internal reference clock of the master (green line) during 1-week monitoring period is presented. All clients were polled at rate 1 per every 64 s.
Direct Ethernet link with a LANTIME M300/GPS Stratum 1 server
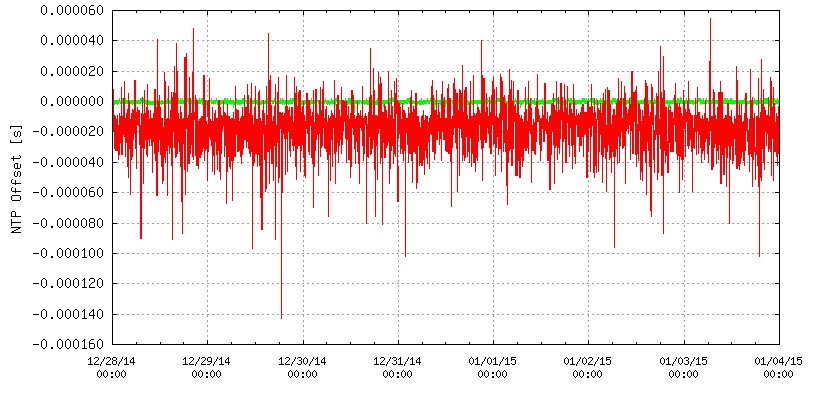
Figure 3: NTP offset trend of a LANTIME server (M300/GPS) attached directly to the master (M600/GPS). This case shows the reference NTP performance (direct link between NTP nodes, no uncontrolled external influence factors). Note that the y-axis scale ranges from -160 to 60 μsec and the Mean Absolute Offset Value lies in the range of -20 μsec.
Spikes in the NTP performance are due to Ethernet hardware jitter and software processing delay variation.
Local network connection with a LANTIME M600/GPS at Stratum 1
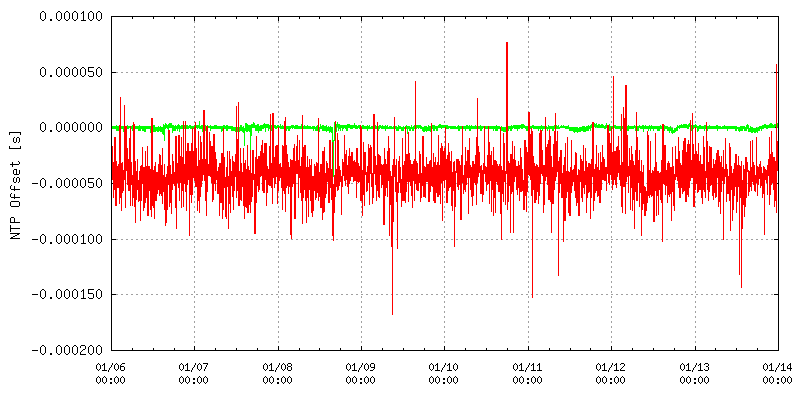
Figure 4: NTP offset trend of GPS sync LANTIME server attached via local network link with the master (M600/GPS). Note that the y-axis scale ranges from -200 to 100 μsec and the Mean Absolute Offset Value lies in the range of -50 μsec.
Spikes in the NTP performance are due to Ethernet hardware jitter and software processing delay variation.
LAN connection with a Windows PC (64-bit Win 7 OS) at Stratum 2

Figure 5: NTP offset of the Windows PC sync to stratum-1 NTP server and attached via local network link to the master server (M600/GPS). Note that the y-axis scale ranges from -2 msec to 2 msec.
Note that software processing delay variation is much greater in this case. This is due also to kernel latencies such as timer interrupt routine, cache reloads, context switches and process scheduling.
Mean Absolute Offset Value lies due to timer / clock resolution in sub- millisecond range.
Public ntp.pool server at Stratum 2 with 9 hops in the data link
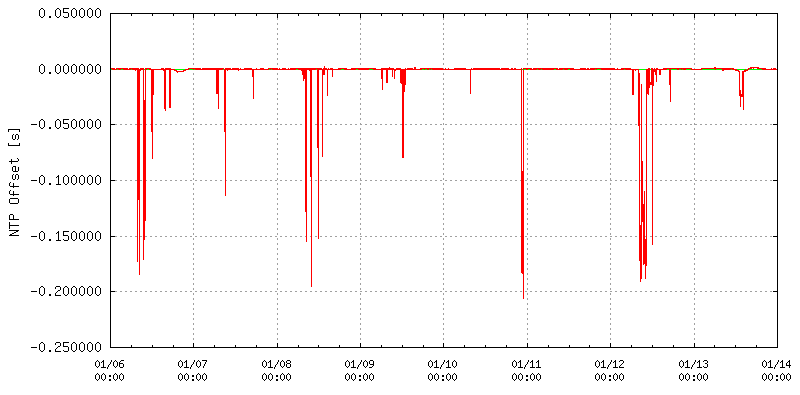
Figure 6: NTP offset from an ntp.pool server (red line) compared to a GPS disciplined internal reference clock (green line). For a better visualization the scale of y-axis is adjusted between -250 and 50 msec. One can observe a high number of spikes in NTP performance which is due to extreme network queuing delays caused by congestions. However in stable periods (between outages and spikes) the Mean Absolute Offset Value lays in a range of sub-milliseconds.
The monitored data are continuously saved on the LANTIME flash card. Data are available at any time for further statistic processing. There is an indicator implemented which informs about the available flash space and the number of days left for monitoring of the current NTP setup.
I hope you find the NTP Mon feature useful and this tutorial a helpful resource. If you wish to learn more about time synchronization, LANTIME features or NTP fundamentals, join us at one of the upcoming trainings at Meinberg Sync Academy:
For any further questions feel free to contact me at andreja.jarc@meinberg.de or check our Meinberg Web Page at: www.meinbergglobal.com.
This is all for today, see you next time. Goodbye!
If you enjoyed this post, or have any questions left, feel free to leave a comment or question below.